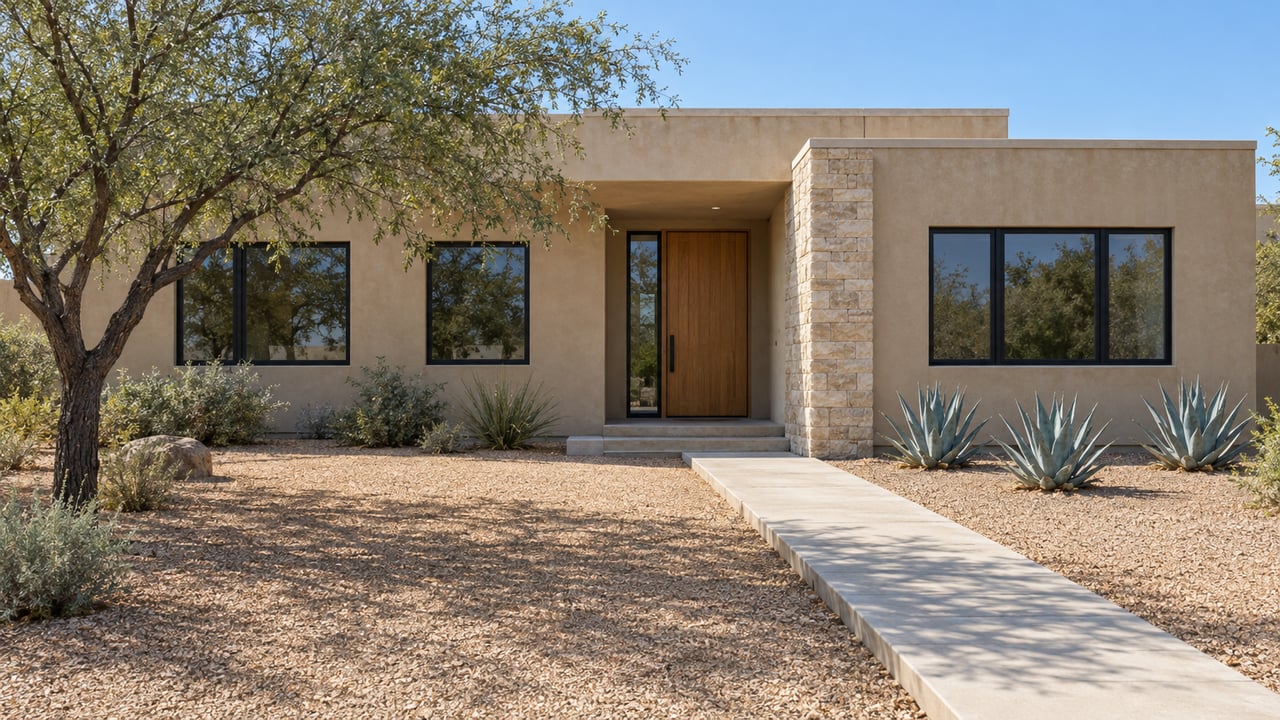
Chandler's Home Sales Look Steady. The Contracts Behind Them Tell a Different Story.
October 29, 2026
October 29, 2026
Chandler closed slightly more homes in September 2026 than it did in September 2025. In the same month, Chandler pending sales fell 47% from a year earlier. Both numbers are accurate. They describe two different stretches of buyer behavior, and this fall the older one is the one showing up in the headlines.
That gap matters most to anyone writing an offer this week. The closed sales your agent pulls as comparables mostly come from contracts signed in midsummer. The contracts being signed now point to a market with fewer buyers and more homes to choose from. Per-foot prices are holding up better than the headline median suggests.
Sammy Glassman, board president of Phoenix Realtors, called out the split directly in his September analysis for the Chandler Independent. "The biggest standout is pending sales, down 47%, even as closed sales increased slightly by 1.6%," Glassman said. "That divergence suggests the market performed reasonably well, based on contracts written earlier, while more recent buyer activity has softened."
A separate count of Arizona Regional MLS data for detached homes shows the same picture from the closing side. Chandler recorded 197 detached sales in September 2026, compared with 194 in September 2025. The September detached median was $549,500, down 0.2% from a year earlier.
Those figures describe a flat, stable year. Most of those sales went under contract weeks before they closed, though, and the contracts that will fill October and November closing reports were written in a slower market.
The clearest current view comes from the Cromford daily snapshot for Chandler single-family detached homes, dated October 17, 2026. It compares that day with one month earlier and with the same point in 2025.
| Chandler detached homes | Oct 17, 2026 | Sept 17, 2026 | One year earlier |
|---|---|---|---|
| Pending listings | 86 | 93 | 134 |
| Listings under contract | 164 | 181 | 249 |
| Sales per month | 173 | 183 | 204 |
| Active listings, excluding those under contract with contingencies | 546 | 501 | 521 |
| Months of supply | 3.2 | 2.7 | 2.6 |
| Average sale price as % of list | 97.40% | 97.80% | 97.67% |
| Listing success rate | 74.9% | 75.9% | 78.5% |
Read across the rows and one side of the market clearly changed more than the other. Listings under contract fell by about a third from a year earlier, from 249 to 164. Active listings outside of contract rose 4.8% over the same stretch, from 521 to 546. The higher months of supply comes mostly from fewer buyers signing contracts, with only a small rise in homes for sale.
The month-over-month moves point the same way. Between September 17 and October 17, the Cromford contract ratio slipped from 36.1 to 30.0. The Cromford Market Index fell from 132.3 to 116.8, with its Supply Index rising and its Demand Index falling.
A broader filter tells a longer story. One ARMLS-based count of Chandler single-family, patio and townhomes under $1 million and over 1,000 square feet found that October 2026 opened with 531 listings. That is 154% of the 2023 to 2025 average of 345 for the same point in the year. Put that next to the detached figures above, where active listings were already 521 a year earlier, and supply looks well above its recent norm without having jumped much in the past year. What changed this fall is how many buyers are signing contracts.
A headline median falling from $580,000 to $533,000 in a month looks like a price break. In the same October 17 snapshot, it mostly reflects which homes happened to close.
Over that month, the average size of a sold Chandler detached home dropped from 2,290 to 2,133 square feet. Monthly sold price per square foot rose from $285.57 to $289.93. Smaller homes made up more of the month's closings, and smaller homes carry smaller price tags, so the median slid while per-foot pricing went up.
The homes still going under contract are holding their per-foot value too. Under-contract price per square foot was $299.65 on October 17, compared with $297.66 a month earlier and $298.25 a year earlier. Over a longer window, annual sold price per square foot was $289.79, against $294.20 a year earlier. That is a soft drift, not a slide.
Fewer buyers usually leads to lower prices eventually. In Chandler this fall, the thinner pool is showing up first in contract counts and listing success, while per-foot pricing on accepted deals has moved little.
If per-foot prices are steady, the room to negotiate shows up in other places.
On price, the gap is real but modest. Chandler detached homes sold for an average of 97.40% of list price as of October 17. On a $533,000 home, that works out to roughly $13,858 under asking. The broader under-$1 million count found sellers received an average of $11,534 less than their asking prices in September 2026. Both figures are a few percent, not the double-digit discounts a falling median might suggest.
The listing success rate shows more change. At 74.9% on October 17, about one in four Chandler detached listings is not ending in a sale. A year earlier the rate was 78.5%. Active listings had been on the market a median of 48 days, while recently sold homes had a median of 44 days on market. A well-priced home still moves at a normal pace. A listing priced above recent per-foot closings in its own subdivision is the one most likely to sit, and that is where a buyer has the most room on terms.
Before writing an offer in Chandler this fall, a buyer can ask:
The citywide median blends very different parts of Chandler. That is part of why a shift in the mix of homes sold can move it so much. A brokerage ZIP report updated in October 2026, using all home types and three-month rolling medians, shows the split.
These are directional. They mix condos and townhomes with detached homes, and the next monthly update could reshuffle them. They still show that two South Chandler ZIP codes next to each other can move in opposite directions over the same quarter. A buyer or seller in Chandler gets more out of subdivision-level per-foot comparisons than out of any single citywide figure.
Chandler's big employers have been in the news all year, and none of the sources above link that news to this fall's contract numbers. Here is what was reported:
These timelines run in years, and the contract slowdown above happened over a few months. For a relocating buyer weighing Chandler against other East Valley cities, the employer news is a long-range factor. The October 17 pipeline is what will shape the next offer.
Is Chandler a buyer's market right now? Not by the Cromford measure. The Cromford Market Index for Chandler detached homes was 116.8 on October 17, 2026. That still counts as moderately seller-leaning, though it is down from 132.3 a month earlier and 127.3 a year earlier. Buyers have more room than they did in September, but well-priced homes are still selling.
Will the October closing numbers settle the question? They will mostly reflect contracts signed in September and early October. Watching pending and under-contract counts as they're reported gives an earlier read than waiting for closed-sale totals.
Did Chandler home prices drop 8% in a month? The October 17 median fell 8.1%. Sold price per square foot rose over the same month because smaller homes made up more of the closings, and under-contract price per square foot held near $300.
If you're weighing a Chandler home this fall, from across town or from out of state, Colleen Marie Heaney can pull the current under-contract and per-foot numbers for your specific subdivision, so your offer or list price matches the market buyers are signing in today. Start your move with a free home valuation, and we'll go through the current numbers together.
Inspiration and Information for Every Move


Whether you’re moving across town or across state lines, Colleen is here to make your transition simple, enjoyable, and stress-free.